Thu 03-10-2019
Hi everyone, hope you are all ok.
Back from nearly 5 months off the "Trading Waves" reporting blog.... Time really flies if you think about it.... The reason was that I moved to a different country with my children and had to keep my daily tasks to the bare minimum...
As they say... How you eat an Elephant?.... One bite at a time...
Well... now that I feel that we are getting settle and have more time, I will be dedicating time to report the daily Elliot Wave Analysis starting with the EURUSD, GBPUSD and USDJPY and adding further gradually.
So... without further delay... lets jump into it
USDJPY
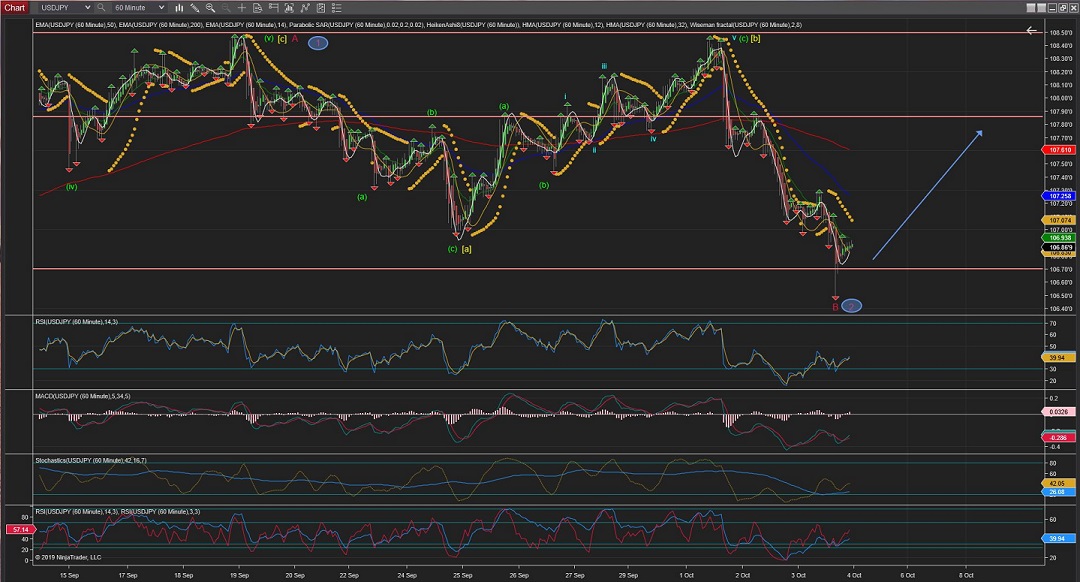
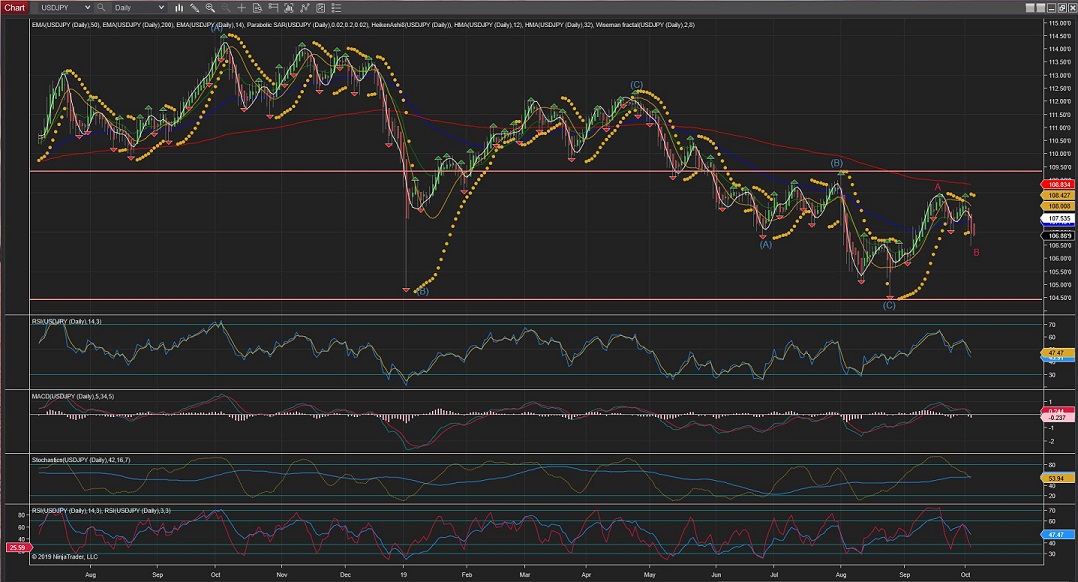
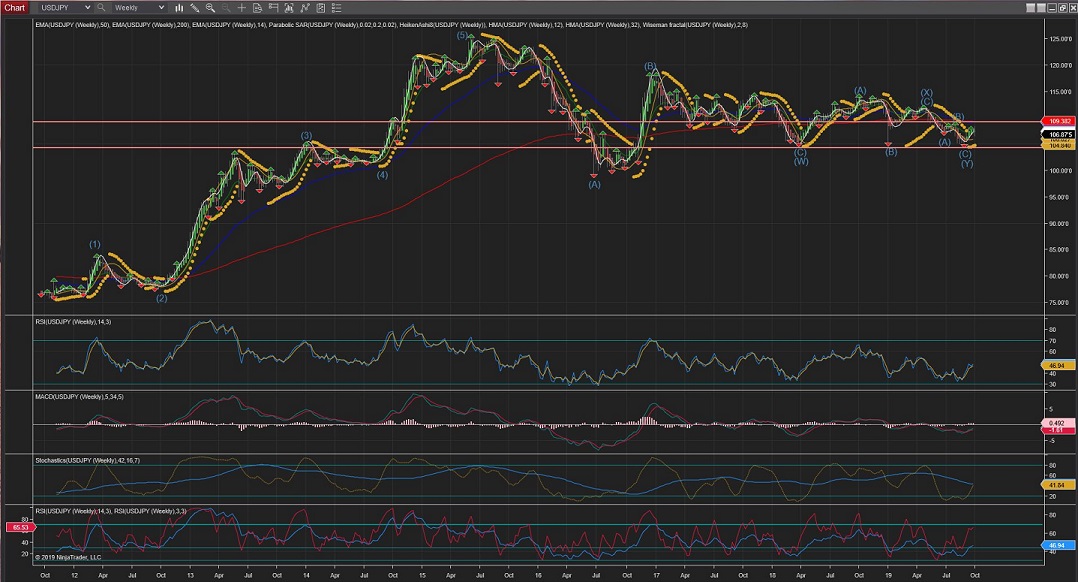
USDJPY is showing to break the long term (4Hour) trend.
The current count for a B(red) wave has peaked at the bottom with a %50 retracement of Wave A(red) which suggest the alternate count for Waves 1(red) and 2(red).
In any case, once the current wave is finished, the price should rise again and that should clear doubts in regards of the current count.
60Mins
4Hours
Daily
Weekly
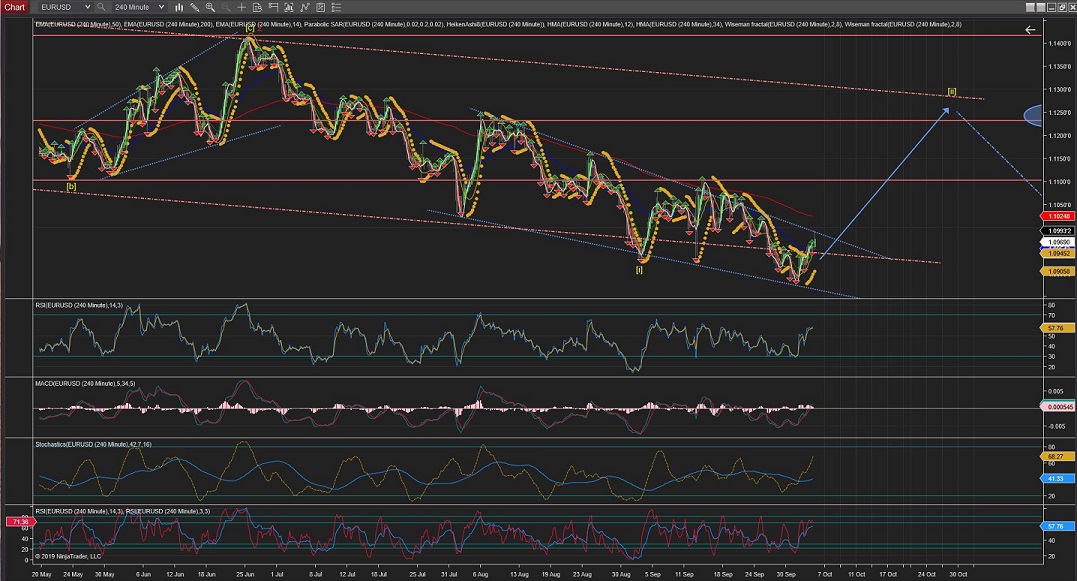
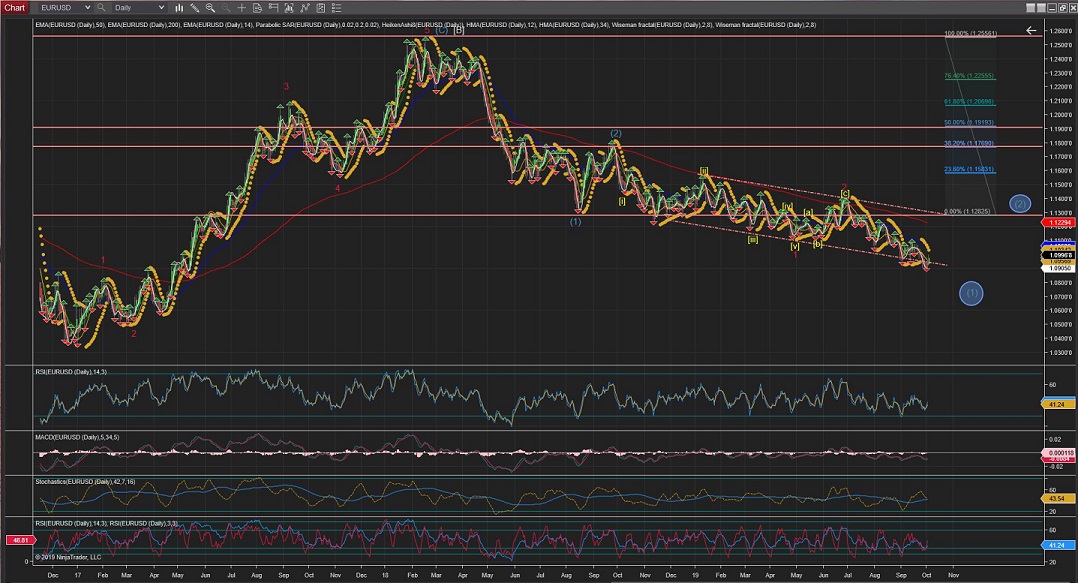
EURUSD
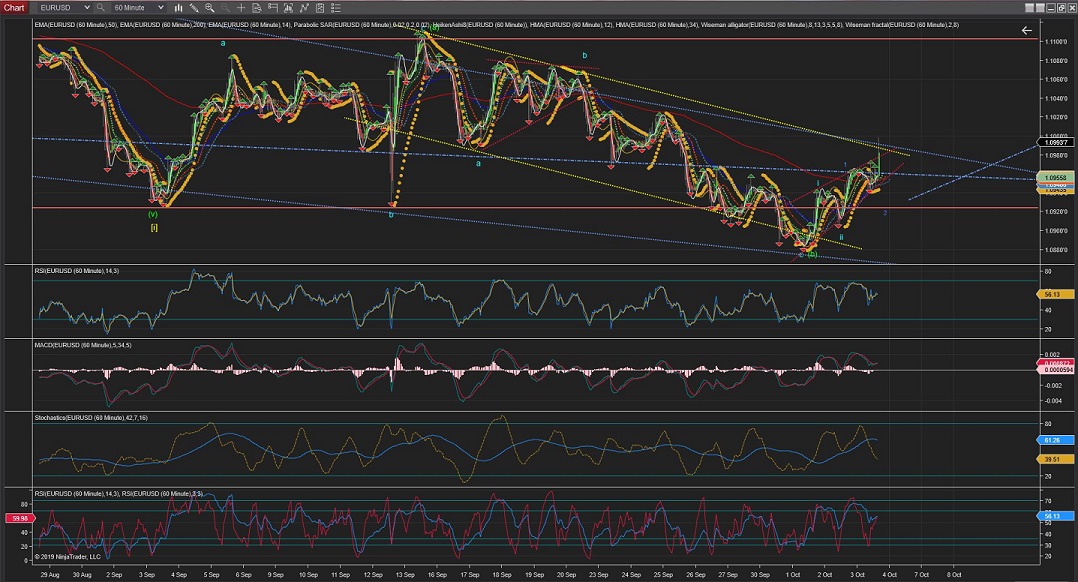
EURUSD is at the bottom of a long term range on the Daily Chart.
The 4Hour and 60Min Chart are showing a Wave (c) raise within a Wave [ii] (yellow) in my current count.
60Mins
4Hours
Daily
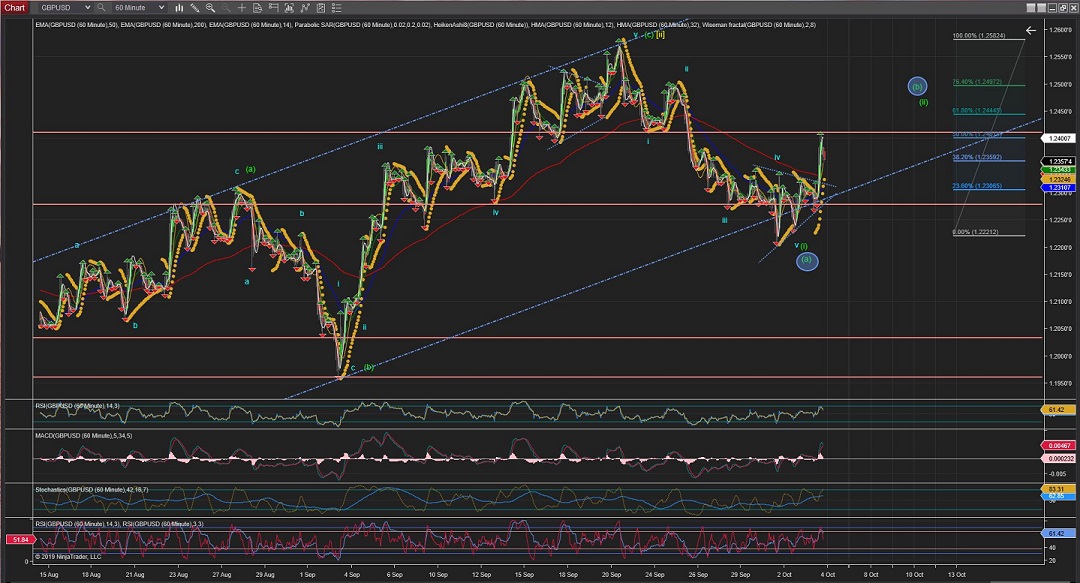
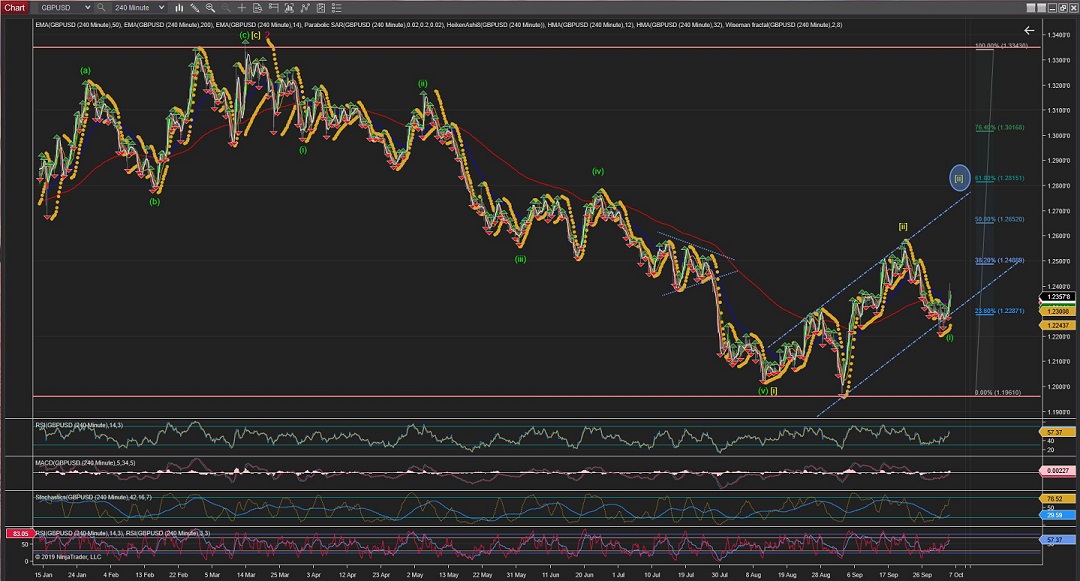
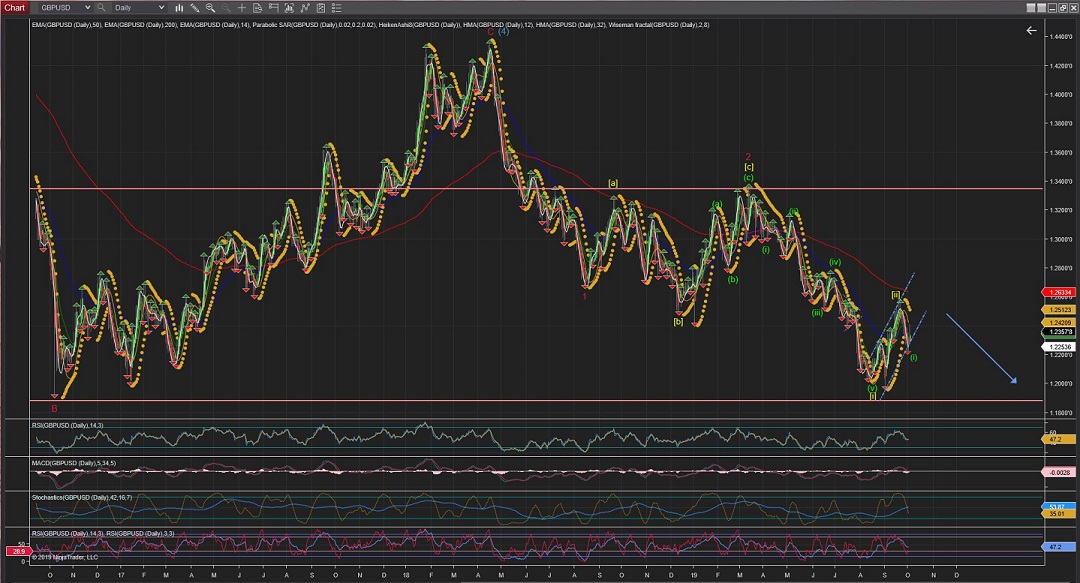
GBPUSD
GBPUSD showing to have completed a Wave[ii] (yellow) within a trend in the 60Min Chart.
The current count is showing the raise today as the initial internal Wave for Wave(ii) to be completed below the 1.2600 price.
The alternate count would be for a combination correction (WXY) for Wave [ii], in which case the current Wave[i] would be a Wave(a) and the current raise today would correspond to the subsequent Wave(b) within Wave(x) part of the correction.
60Mins
4Hours
Daily
All the best for everyone and please do contact me with any question or comments as I will be reading and, if it is the case, come back with a reply.
Andres
info@tradingwaves.org

 Trading Waves .org